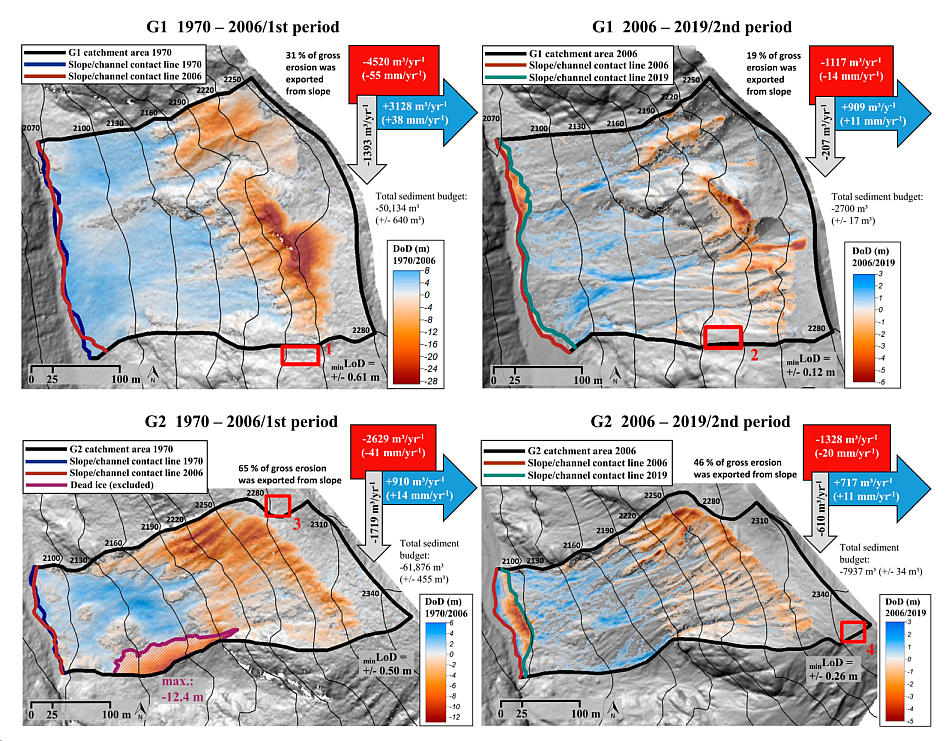
Our figure (see below) depicts morphodynamics of almost 50 years (between 1970 and 2006, and between 2006 and 2019, respectively) of two lateral moraine sections at Gepatschferner, Kauner valley, Austria.
Photogrammetric methods, airborne and terrestrial laserscanning were used to generate digital elevation models representing the surfaces in 1970, 2006 and 2019, respectively. Subtraction of two elevation models representing the surface elevation at two points in time yields a ‚DEM of difference‘ (DoD). Each pixel of the DoD shows the net surface change (e.g. negative change=>erosion, positive change=>deposition) that occurred in the period between the surveys. We interpret the spatial pattern of positive and negative surface changes (on a red-white-blue colour ramp) in terms of processes that shaped the surface during this period. Moreover, we can compute the volume of sediment that was removed (erosion) or deposited at certain sections of the hillslope.
A comparison of the first (1970-2006) and the second (2006-2019) period shows that the respective volumes of erosion, deposition and sediment delivery to the adjacent river have decreased. These findings have been published in the scientific journal Water – you can access the original paper here: https://www.mdpi.com/2073-4441/12/12/3375.